


SwitchyOmega was exposed to stealing private keys. How to prevent plug-ins from being tampered with?
10 mins ago
6,892


Source: Glassnode; Translated by: Tao Zhu, Golden Finance
AbstractIn early January, Bitcoin entered a stage of strong investors' distribution, and the cumulative trend score confirmed the ongoing seller pressure.
Intensified volatility, weak demand and liquidity restrictions have hindered meaningful accumulation restarts and exacerbated downside risks.
The panic-induced sell-off is intensifying, with STH-SOPR soaring to well below break-even level 1, indicating that buyers are scared and aware of the loss in the near future.
The custom SOPR-adjusted CDD metric we developed shows that the intensity of the sell-off reflects past sell-off events, especially in August 2024, when the market plummeted to $49,000.
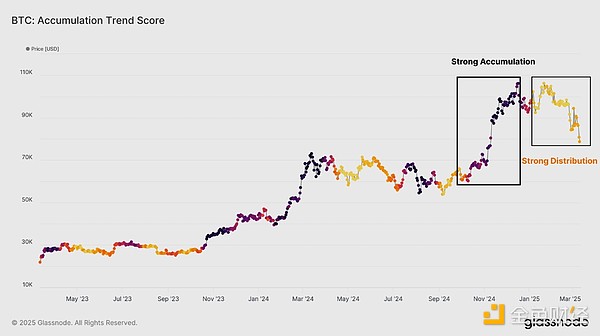
Seller pressure still existsBitcoin's cyclical behavior is the product of the accumulation and distribution stage, and over time, capital rotates among investor groups. Accumulation trend scores track these changes, with values close to 1 (dark purple) representing large accumulations and values close to 0 (yellow) representing allocation.
The following figure shows how the allocation phase occurs after several accumulation cycles, which historically resulted in weaker price movements. The latest allocation phase began in January 2025, consistent with Bitcoin’s sharp correction from $108,000 to $93,000.
The accumulation trend score is still below 0.1, indicating that seller pressure continues.
The cumulative trend score measures the relative change in the total balance on the chain. However, it is often affected by larger entity behavior and does not reveal where Bitcoin is acquired. While it highlights overall accumulation or allocation trends, it lacks the granularity to pinpoint the critical cost base level.
To gain more in-depth insights, we can turn to the Cost Base Distribution (CBD) heatmap, which visually shows where supply concentrations form over different price ranges, helping us identify potential support or resistance areas.
Party participants actively accumulate BTC during the pullback from mid-December to late February, especially in the $95,000 to $98,000 price range. This buying behavior on dips indicates that investors are still convinced of the bull market trend, interpreting the pullback as a temporary pause before further gains.
From the end of February, as liquidity conditions tighten, confidence in accumulated starts to deteriorate. External risk factors, including Bybit hacking and escalating U.S. tariff tensions, have exacerbated uncertainty in the market, with Bitcoin falling below $92,000. This level is crucial because it reflects the market’s fall below the cost base of short-term holders.
Unlike the early stages, there was no obvious buying reaction on dips this time, indicating that emotions have turned to hedging and capital preservation rather than continued accumulation.
CBDThe heat map confirms that accumulation demand weakens as macro uncertainty increases, which further suggests that investor confidence is a key driver of accumulation behavior. The lack of low-level buying indicates that capital rotation is in progress and may lead to longer consolidation or adjustment phases before the market can find a solid support base.
Demand momentum is fallingWe are now using CBD heat maps and accumulation trend scores to highlight the lack of substantial accumulation since the end of February. We can study this behavior more deeply by analyzing the cost basis of two short-term holders (STH) subgroups:
1 week-January Holders – Investors who purchased BTC in the last 7 to 30 days.
January – March Holders – Investors who bought BTC 1 to 3 months ago.
In periods of strong capital inflows, the cost basis of the 1-week-January group is usually higher than the cost basis of the 1-March group. This suggests that newer investors are buying BTC at a relatively premium, reflecting bullish sentiment and positive momentum. However, in the first quarter of 2025, this trend began to flatten, marking an early sign of a weakening demand in the near term.
As Bitcoin price falls below $95,000, the model also confirms the shift to net capital outflows as the 1-week-Jan cost base falls below the 1-March cost base. This reversal suggests that macro uncertainty scares demand, reduces new inflows, and arguably increases the possibility of further selling pressure and long-term adjustments.
This shift shows that new buyers are now reluctant to absorb seller pressure, strengthening the shift from record-breaking excitement to a more cautious market environment.
Assessing fearAs the market enters the post-ATH allocation phase, it becomes crucial to assess the level of fear in the short-term holder group, especially those entering recently. Understanding the behavior of this group helps market observers identify moments of extremely exhausted sellers, which historically provides opportunities for long-term investors.
A key indicator of this analysis is the short-term holder expenditure output margin (STH-SOPR), which measures whether STH is profitable (SOPR > 1) or loss (SOPR < 1).
STH-SOPR's 196-hour moving average has remained below 1 since the price fell below $95,000, indicating that most short-term investors are making losses. In extreme moments, STH-SOPR dropped to 0.97 as the price plummeted to $78,000, highlighting the severity of the sell-off.
This continued downward momentum has nervous new investors, leading to a widespread panic loss selling. This situation usually precedes exhaustion by local sellers, and long-term investors may monitor this dynamic in search of potential return-to-market opportunities.
In addition to tracking the realization of losses, another key indicator of panic selling is the number of tokens destroyed by short-term holders (STH-CDD), which measures the economic weight of tokens spent by new investors by taking into account the number of tokens and the time they are held.
STH-CDD will soar during a sharp market decline as investors are about to become long-term holders who will panic selling, destroying a large number of token days. This suggests that short-term holders who have experienced uncertainty have sold out, which may increase downward pressure.
Combining these two concepts, we can construct an indicator that adjusts STH-CDD by incorporating the strength of profit/loss achievement using the following formula:
(SOPR_STH - 1) *CDD_STH
This indicator improves STH-CDD by weighting the intensity and direction of the achieved profit and loss, thereby providing a more accurate panic selling signal.
As shown in the figure below, the recent sell-offs by top buyers reflect serious loss realization and moderate sell-off events. A similar pattern emerged in August 2024, when Bitcoin plunged to $49,000 amid market pressure and macro uncertainty. The current structure indicates that there is a similar selling phase.
Bear Market CompassBecause seller pressure comes primarily from investors who have recently purchased tokens at relatively high prices, it is wise to judge the depth that the current bear market may reach. To evaluate this, we will use various statistical intervals based on the short-term holder cost basis as readings for the psychological fair value extreme value.
The following figure shows the statistical high and low range of price deviations derived from these cost-based models.
Currently, the lower limit of the model (short-term holders are in a dilemma) ranges between $71,300 and $91,900. It is worth noting that this range is consistent with the liquidity gap between $70,000 and $88,000 discussed previously, suggesting that there is a high possibility of a temporary bottom in the region, at least in the short term.
SummaryBitcoin's market structure has entered the distribution stage after ATH, with weak total demand and the recent pressure of top buyers to sell. The cumulative trend score has remained near 0.1 since early January, while the CBD heat map shows that investors’ buying responses on dips are weakening.
Using the cost base of short-term holders, we can see that market momentum and capital flows have turned negative, indicating a decline in demand intensity and investor uncertainty is affecting sentiment and confidence.
Short-term holders sell out due to fear, which continues to fall below 1 and STH-CDDIt can be seen in the soaring. This local sell-off event is also consistent with the market trading towards a lower statistical range, and investors may be experiencing high financial pressure in the near future.
