


5 hours ago
5,864
Author: Nancy Lubale, CoinTelegraph; Translated by: Deng Tong, Golden Finance
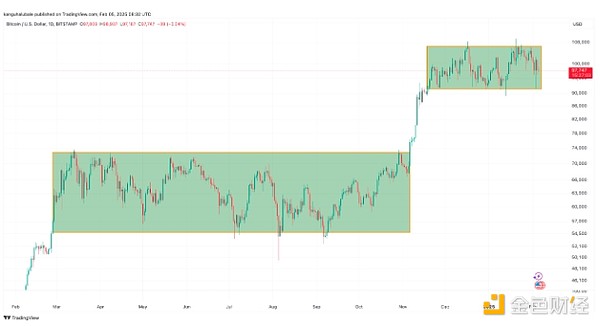
Since the first breakthrough of the $90,000 mark on November 19, the price of Bitcoin has been converging between $91,500 and $106,500. .
But based on several technical and on-chain indicators, Bitcoin’s consolidation may be nearing its end. The key question remaining is when Bitcoin will break through consolidation.
BTC/USD daily chart. Source: Cointelegraph/TradingView
Bitcoin price trend: currently sideways consolidationA cryptocurrency analyst said Bitcoin may continue to consolidate in the current range for some time, especially in US President Donald Terr Trump's tariff threat sparked massive cryptocurrency liquidation and raised concerns about a trade war.
In a February 5 analysis of X, Rekt Capital said that although Bitcoin retested $101,000 on February 3, BTC failed to “turn the daily closing price into a new one Support level”. He added:
"BTC may temporarily consolidate between $98,300 and $101,000."
BTC/USD Daily Candle Chart. Source: Rekt Capital
For independent analyst Arjantit, Bitcoin’s current consolidation cycle may continue until the end of February.
Arjantit said:
Bitcoin price is consolidating after a 15-week increase (+105%).
As long as BTC/USD remains above $90,000, its daily structure will remain strong.
However, a break below $90,000 could be a “buy opportunity.”
The consolidation cycle may end at the end of February, after which BTC will rebound to $120,000.
BTC/USD weekly chart. Source: Artjantit
BTC demand has not yet peakedAs BTC prices break through the $100,000 mark, many market participants expect investors' exposure to Bitcoin to increase. However, data show that new demand is still "much lower than" demand during the peak periods of previous cycles.
Glassnode describes the current BTC price trend as an "atypical market cycle"”, its latest Week On Chain report states:
New demand for Bitcoin was 26% when it hit an all-time high in 2017 and 32% at its peak in 2021.
At the moment hit an all-time high of $109,000, new demand was 23%.
Glassnode added:
[T] New demand for BTC comes primarily from large entities, not small retail investors Entities.
HODL ratios implemented by Bitcoin. Source: Glassnode
So, small businesses may be required Continuously provide new demands to end the current integration period.
At the same time, Google Trends also shows that social interest has declined compared to previous cycles:
Bit The search volume of coins has not reached the level during the 2021 bull market.
Bitcoin interest changes over time. Source: Google Trends< /p>
Once investor interest heats up again, Bitcoin may break through the consolidation phase.
Bitcoin price breakthrough is coming—Bolling BandsBitcoin volatility indicator shows that Bitcoin price The consolidation is a precursor to a major breakthrough.
Key points:
The conditions for tightening the Bollinger bands indicate that the breakthrough may be very close.
The daily Bollinger band bandwidth is extremely super Sell, touching the green line below.
The width of the Bollinger band is currently narrower than when Bitcoin priced at $68,000 in November 2024.
BTC/USD followed from November 5 $67,300 rose 46% to $99,317 on November 22.
The indicator was also so tight in June 2024 and January 2024, after BTC prices rose 31% and 19% respectively .
BTC/USD daily chart. Source: Cointelegraph/TradingView
If history repeats itself, Bit The price of the coin will break through the current range in the next few days or weeks.
