Author: Prem Reginald Translation: Vernacular Blockchain
Inspired by Donald Trump winning the presidential election Encouragingly, the cryptocurrency market in 2024 is showing a vertical growth trend. As a platform for decentralized applications (dApps) and smart contracts, the demand for L1 solutions has increased significantly, and major L1 blockchains have fiercely competed for the top position. However, they face strong challenges from Layer 2 (L2) solutions that strive to increase transaction speeds at extremely low costs, thereby competing with established blockchains such as Ethereum.
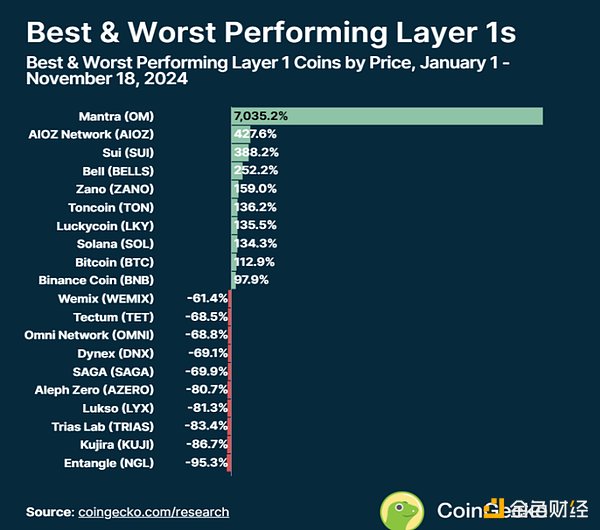
1. Which Layer 1Tokens perform best?Among the top-performing tokens, Mantra (OM) has seen unprecedented growth, surging 7,035.2% in value. This surge is partly due to Mantra’s partnership with UAE-based digital bank Zand. Zand tokenizes real world assets (RWA) by complying with Dubai Virtual Asset Regulatory Authority (VARA) regulations. In addition, demand for RWA products continues to grow, and traditional financial institutions are also introducing currency funds and bonds to the blockchain.
2. Other Tokens with Outstanding PerformanceAIOZ Network (AIOZ) is another performer Standout player, with year-to-date (YTD) growth of 427.6%. The platform’s decentralized content distribution network is seeing increasing adoption, driven by continued ecosystem optimization. Rounding out the top three is Sui (SUI), which grew 388.2% YTD, benefiting from rapid development within its ecosystem, including innovative dApp launches that leverage its high scalability and developer-friendly features.
Other performers to watch include:
Bellscoin (BELLS): up 252.2%
Zano (ZANO): up 159%
Toncoin (TON): up 136.2%, through integration with Telegram, successfully hosted dApps and launched “click and earn” games.
3. The growth rate of the top ten Layer 1Tokens by market capitalization is relatively moderateAlthough the performance of Layer 1Tokens with small and medium market capitalization is amazing, Tokens with larger market capitalization such as Bitcoin, Ethereum and Solana remains a solid investment choice.
Bitcoin (BTC) has achieved annual growth of 112.9%.
Ethereum (ETH) grew 34.9%, but underperformed similar tokens. With the rise of new Layer 2 and other blockchains, Ethereum’s dominance has declined year over year, despite the launch of a spot Ethereum ETF in the United States. However, Ethereum is still outperforming the S&P 500, which is up 24.8% in 2024.
Solana (SOL): Rising from the AshesSolana (SOL) From FTX 2022 Rising from the shadow of bankruptcy, it is up 134.3% year to date. Most of its gains occurred in 2023, when the price surged from $15 to $120, driven by the memecoin craze. This trend also extends to other blockchains, such as Tron Network (TRX), which has grown 85.5% this year.
Meanwhile, Toncoin (TON) recorded a staggering 136.2% growth, driven largely by its ability to host dApps on popular social messaging app Telegram. The click-and-earn gaming model has become extremely popular on Telegram, further fueling its growth.
Sui: The most eye-catching performanceSui has the most eye-catching performance this year, with a growth of 338.2%. This increase was mainly driven by increased investor interest, growing on-chain activity, and increased utility through significant dApp expansion. Additionally, Circle’s USDC has been integrated into the network, while a trend of funds moving from Ethereum to Sui has also been observed.
4. The biggest dropOn the other hand, some tokens have fallen as much as -96% so far this year.
Entangle (NGL) has been the worst performer, with YTD falling -95.3% .
Following them are Kujira (KUJI) and Trias Lab (TRIAS), which fell -86.7% and -83.4%, respectively.
< p style="text-align: left;">NGL was issued at a higher valuation in March 2024 and has continued to trend lower since then, while Kujira's performance has been affected by the team's high-risk leveraged liquidity positions, which have been affected during market volatility. The strategy is counterproductive. 5. How will the Layer 1 tokens launched in 2024 perform?How will the various Layer 1 tokens launched in 2024 perform? Cryptocurrency performance has been mixed, reflecting the challenges of breaking out in a competitive market
Aleo (ALEO), which launched in September, has fallen since its launch. 58.1%.
Saga (SAGA), which launched in April, faces similar difficulties and is down -69.9% year to date. -align: left;">Also in 4 Omni Network (OMNI), which launched in February, is down -68.8%
Zeta Chain (ZETA), which launched in February, is down -57.3% so far. p>
Performance of Router Protocol (ROUTE) and other new projects
Router Protocol (ROUTE), launched in July, has seen its price fall by 24.8%, while Ice Open Network (ICE) has seen a relatively smaller decline of 34.5% since becoming active in January. Meanwhile, Kaia (KAIA) entered the market as late as the end of October. ) achieved slightly positive growth of 5.2%. These performances reflected the newThe volatility of Layer 1 projects, and the importance of continued innovation and user adoption to gain market acceptance.
6. Top ten Layer 1 projects ranked by price performanceNote: YTD is Year The abbreviation of -to-Date means "this year to date". It is often used to describe the performance of a metric (such as earnings, change, or performance) over a period from the beginning of the year (usually January 1) to the current date.
7. ConclusionIn 2024, the Layer 1 blockchain field will show diversified performance. Mantra leads the way with a whopping 7,035% year-to-date (YTD) gain, driven by its strategic partnerships and cutting-edge blockchain use cases. Established players such as Bitcoin, Solana and Toncoin have performed solidly, proving that they still have strong vitality in the ever-changing market. At the same time, newly issued Tokens face huge challenges and often struggle due to high valuations.
As competition between Layer 1 and Layer 2 solutions intensifies, a focus on scalability, usability and compliance will determine the next wave The emergence of winners is particularly important in this ever-changing crypto market.
Note: This study analyzes the price returns of the top 100 cryptocurrencies ranked by market capitalization under the Layer 1 category in CoinGecko. Statistical YTD gains cover performance from January 1 to November 18, 2024. These data reflect a cross-section of the market and reflect differences in the performance of individual currencies within the broader market environment.


