


2025-01-27 09:03
9,269
Author: Matt Crosby, Bitcoin Magazine; Compiled by: Deng Tong, Golden Finance
As Bitcoin prices reach six figures, it has become the norm, and higher prices seem to be inevitable. Analysis of on-chain data provides valuable insights into the underlying health of the market. By understanding these indicators, investors can better predict price movements and prepare for potential market peaks or even any upcoming pullbacks.
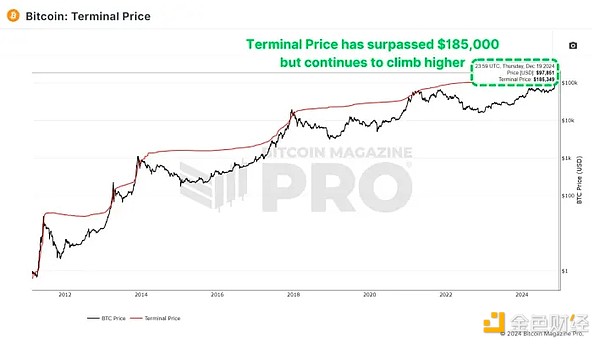
Terminal PriceThe terminal price indicator combines coin days destroyed (CDD) while taking into account the supply of Bitcoin, and has historically been a reliable indicator for predicting the peak of the Bitcoin cycle. Coin Days Burned measures how quickly coins are transferred, taking into account holding time and the amount of Bitcoin moved.
Figure 1: Bitcoin terminal price has exceeded $185,000.
Currently, terminal prices are over $185,000 and could rise to $200,000 as the cycle progresses. Since Bitcoin has already surpassed $100,000, this means we may still have several months of positive price action ahead.
PUELL MULTIPLEThe Puell Multiple evaluates a miner's daily revenue (in USD) relative to its 365-day moving average. After the halving event, miners' income dropped sharply, forming a period of consolidation.
Figure 2: The Puell multiple has climbed above 1.00.
Now, the Puell multiple has risen back above 1, indicating that miners will return to profitability. Historically, exceeding this threshold indicates the late stages of a bull market cycle, usually marked by exponential price increases. A similar pattern has been observed in all previous bull markets.
MVRV Z-ScoreThe MVRV Z-Score measures market value relative to actual value (the average cost basis of Bitcoin holders). Normalized to a Z-score to account for an asset's volatility, it is highly accurate at identifying cycle peaks and troughs.
Figure 3: MVRV-Z scores remain well below previous peaks.
Currently, Bitcoin’s MVRV Z-score remains below the overheating red zone at around 3.00, suggesting there is still room for growth. While declining peaks have been a trend in recent cycles, the Z-score suggests that the market is far from its euphoric peak.
Active Address SentimentThis metric tracks the 28-day percentage change in active network addresses and the price change over the same period. When price growth exceeds network activity, this indicates that the market may be overbought in the short-term, as positive price action can occur given network utilization.Can it be sustained?
Figure 4: AASI indicates overheating above $100,000.
Recent data shows that the market has cooled slightly after Bitcoin’s rapid climb from $50,000 to $100,000, suggesting that the market is in a healthy period of consolidation. This pause may set the stage for sustained growth in the longer term and does not mean we should be pessimistic about the medium to long term.
Spent Output Profit Profit RatioSpent Output Profit Profit Ratio (SOPR) measures the realized profits of Bitcoin transactions. Recent data shows an increase in profit-taking, which may indicate that we are entering the later stages of the cycle.
Figure 5: SOPR large-scale profit-taking cluster.
One issue to consider is the increasing use of Bitcoin ETFs and derivatives. Investors may switch from self-custody to ETFs for ease of use and tax benefits, which may impact SOPR value.
Value Days DestroyedThe Value Days Destroyed (VDD) multiple scales CDD by weighting larger long-term holders. When this indicator enters the overheated red zone, it often signals a major price spike as the market's largest and most experienced players begin to cash out.
Figure 6: VDD is a bit hot, but not too hot.
While Bitcoin’s current VDD levels suggest the market is slightly overheated, history suggests Bitcoin is likely to remain in this range for several months before peaking. For example, in 2017, VDD indicated that overbought conditions were occurring nearly a year before the cycle peaked.
SummaryTaken together, these indicators suggest that Bitcoin is entering the later stages of a bull market. While some indicators point to cooling or slight overexpansion in the near term, most point to considerable upside remaining throughout 2025. Key resistance this cycle is likely to occur between $150,000 and $200,000, with indicators like SOPR and VDD providing clearer signals as we approach the peak.