


33 mins ago
8,459
Author: Bitcoin Magazine Pro; Compiled by: Vernacular Blockchain
As Bitcoin now enters the With six-digit ranges becoming the norm and higher prices seeming a certainty, analysis of key on-chain data can provide valuable insights into the underlying health of the market. By understanding these indicators, investors can better predict price movements and prepare for potential market peaks or upcoming pullbacks.
1. Terminal value priceThe "terminal value price" indicator combines the number of days to destroy coins (CDD) and the supply of Bitcoin, and has always been regarded as predicting Bitcoin. Effective tool for cycle peaks. Simply put, the number of days to destroy coins is a measure of the activity of Bitcoin transactions. It looks at both the length of time the currency is held and the number of Bitcoins involved in the transaction.
Translator's Note:
Terminal Price is used to predict bits An indicator of the price highs of cryptocurrencies such as BTC. It combines Bitcoin supply with on-chain transaction data, such as Coin Days Destroyed (CDD), to assess market activity and investor behavior.
Coin Destruction Days (CDD): Simply put, it depends on how long the Bitcoin was held before it was transferred, and also considers the amount of the transfer.
The role of terminal value price: When the terminal value price becomes high, it usually means that market trading is active or even overheated, and may be close to the high point of this bull market.
In layman's terms, the terminal value price is like a "market thermometer" to help investors determine whether Bitcoin is in the late stages of a bull market or is about to adjust. .
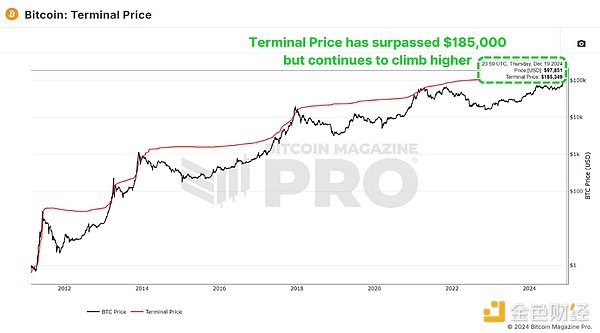
Figure 1: Bitcoin’s final price has exceeded $185,000
Currently, the final price of Bitcoin has exceeded US$185,000, and may further rise to US$200,000 as the cycle develops. Given that Bitcoin has surpassed $100,000, this suggests that the price may still maintain a positive upward trend in the coming months.
2. Puell multiplePuell multiple will reduce daily miners byRevenue (in USD) is evaluated by comparing it to its 365-day moving average. After the halving event, miners' income dropped significantly, causing the market to enter a period of consolidation.
Figure 2: Puell multiple has climbed above 1.00
Currently, the Puell multiple has risen back above 1, indicating that miners' profitability is returning. Historically, breaching this threshold typically heralds the later stages of a bull market cycle and is often accompanied by exponential price increases. This pattern has been seen in all previous bull markets.
3. MVRV Z-scoreMVRV Z-score provides key insights by measuring the relationship between market value and realized value (the average cost basis of Bitcoin holders) Market signals. To account for asset volatility, the indicator is normalized to a Z-score and has demonstrated high accuracy in identifying cycle highs and lows.
Figure 3: MVRV Z-score is still significantly lower than the previous cycle high
Currently, Bitcoin’s MVRV Z-score is about 3.00, which has not yet entered the overheated red zone, indicating that the market still has room for growth. While lower highs have been the trend in recent cycles, the Z-score shows that the market is still some way off from reaching its peak.
4. Active Address SentimentThis indicator tracks the percentage change of active network addresses within 28 days and compares it with price changes in the same period. When price growth exceeds network activity, it indicates that the market may be overbought in the short term, as positive price performance may be difficult to sustain in the absence of network underutilization.
Figure 4: AASI shows signs of overheating as Bitcoin breaks through $100,000< /p>
The latest data shows that after Bitcoin quickly climbed from $50,000 to $100,000, the market has cooled slightly, indicating that it is currently in a healthy consolidation period. This correction could set the stage for sustained growth in the long term, but it doesn't mean we should be pessimistic about medium- to long-term trends.
5. Spent output profit rate (SOPR)Spent Output Profit Ratio (SOPR) measures the profit realized on Bitcoin transactions. The latest data shows an increase in profit-taking, which may indicate that we are entering the later stages of the cycle.
Figure 5: A large number of SOPR aggregations show profit-taking behavior
One thing to note is the increasing use of Bitcoin ETFs and derivatives. Investors may be switching from self-custody to ETFs in pursuit of convenience and tax advantages, which may have an impact on SOPR numbers.
6. Value Days to Destroy (VDD)Value Days to Destroy (VDD) multiplier adds value to long-term large holdings on the basis of Coin Days to Destroy (CDD) the weight of the person. When this indicator enters the overheated red zone, it usually indicates that price has reached a major high as the market's most experienced large players begin to cash out.
Figure 6: VDD is at a high but not overheated level
< p style="text-align: left;">Bitcoin’s current VDD levels suggest the market is slightly overheated, but history suggests this range can last for months before peaking. For example, in 2017, VDD showed signs of being overbought nearly a year before the top of the cycle. 7. ConclusionTaken together, these indicators indicate that Bitcoin is gradually entering the later stages of the bull market. While some indicators suggest short-term cooling or are slightly overbought, most still highlight considerable upside potential through 2025. Key resistance levels for this cycle are likely to be between $150,000 and $200,000, with indicators such as SOPR and VDD providing clearer signals closer to the peak.
