


31 mins ago
9,060
Author: Nancy Lubale, CoinTelegraph; Translated by: Tao Zhu, Golden Finance
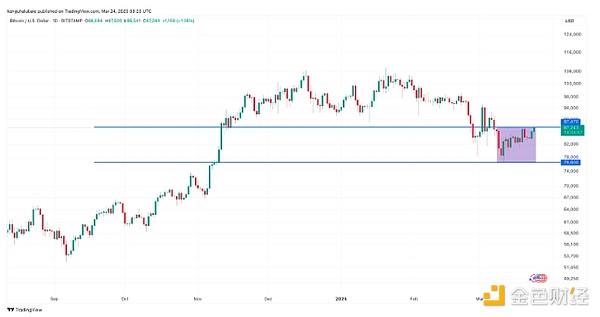
BTC prices have been consolidating between $76,600 and $87,500 since March 11.
Bitcoin consolidation may last for some time, according to technical and on-chain indicators. The key question remaining is when Bitcoin will break through the current consolidation range.
XRP/USD daily chart. Source: Cointelegraph/TradingView
BTC price must rebound to $90,000 before ending consolidationA well-known cryptocurrency analyst said Bitcoin may continue to consolidate in the current range for some time, especially if $90,000 cannot be recovered.
Market analyst Daan Crypto Trades said in a post on March 23 X:
BTC price movements have been “volatile” since March 11, failing to produce continuous green or red candles over the daily time frame.
Once the price returns to its previous range (above $90,000), sentiment and momentum will be beneficial to the bulls again.
If this happens, "it will be a new high soon."
If you don't do this, it will be possible to retest the "2024/Summer Consolidation" between $73,000 and $74,000, which should at least provide some support.
"At present, the price is basically at the middle level."
BTC/USD daily chart. Source: Daan Crypto Trades
The same was expressed by analyst Jelle, who said Bitcoin’s current consolidation cycle could continue until the price breaks through $90,000.
"Break this and things will get really, really good again."
For analyst Rekt Capital, Bitcoin's weekly closing price must be above $88,000 to confirm a higher breakthrough.
In a March 24 article, the analyst said:
Bitcoin is about to retest the resistance provided by the 21-week index moving average (EMA) (green), which is the top of the triangle market structure generated by the 21-week EMA and the 50-week EMA.
BTC needs to close above green EMA $88,400 per week and then retest to confirm the outbreakBreak $93,500.
A similar price movement occurred in 2021, when Bitcoin closed more than $40,000 on weekly prices, and the candlesticks retested the level the following week and moved upward.
"If history repeats itself, it would be no surprise that such fluctuations are around the 21-week EMA."
BTC/USD weekly chart. Source: Rekt Capital
BTC Financing Rate Stays LowOne of the most obvious signs that Bitcoin’s future price trend will be more volatile is the decrease in negative financing rates and open interest (OI) in its futures market.
Key Points:
Finance rates are regular payments between long and short traders in perpetual futures contracts to keep prices consistent with the spot market.
When the indicator becomes negative, the bears pay to the longs, indicating bearish sentiment.
BTC financing rate is about 0%, indicating that the market is hesitant.
BTC perpetual futures financing rates on all exchanges. Source: Glassnode
When financing rates are zero, the cost of holding positions is extremely low, reducing the pressure on traders to exit long or short positions.
This can stabilize the price of Bitcoin in the short term, as neither party pays a premium, thereby suppressing volatility and leading to a continuous consolidation.
This may also indicate accumulation before a potential rebound, or allocation before another round of decline.
Trading company QCP Capital said in a Telegram report to investors that despite Bitcoin’s “moderate rebound” over the weekend, breaking $85,000, “financing rates remain flat,” adding:
“We are still cautious about the prospect of continuing to break through higher.”
Bitcoin price consolidation is coming to an end—Bollinger BandsBitcoin volatility indicator shows that expectations for a BTC price breakthrough are growing.
Key Points:
The conditions for tightening the Bollinger bands indicate that the breakout may be very close.
The Bollinger Band is at an extremely oversold level every week, touching its lower green line.
The width of the Bollinger band is as tight as it was between July 2024 and October 2024, when it consolidated between $63,000 and $69,000, setting an all-time high in 2021.
The BTC/USD pair has since risen 60% from $67,500 in October 2026 to a 2024 high of 1$06,000.
The indicator was also so tense between June 2023 and September 2023, after BTC price rose 176% from $24,400 to $73,800 on March 14, 2024.
BTC/USD daily chart and Bollinger band. Source: Cointelegraph/TradingView
If history repeats itself, Bitcoin may soon break through the current range in the coming weeks.

