Author: Prem Reginald, CoinGecko; Compiled by: White Water, Golden Finance
Bitcoin (BTC) is known as the "magic Internet currency", perhaps the same as traditional assets such as stocks, commodities and bonds Parallel legal investment assets. Looking at the 10-year returns, BTC did perform well, with a return of 26,931.1%. While these numbers are great, it's important to consider its short- and long-term performance relative to other assets.
Which asset has performed best on year-to-date, one-year, three-year, five-year and ten-year time frames?
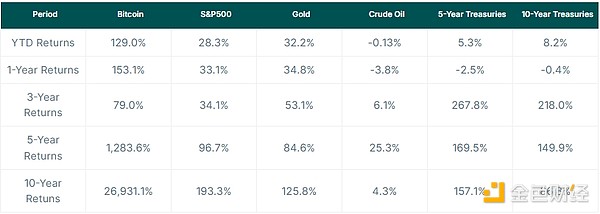
Performance over different time frames reveals the strengths and weaknesses of each asset. In 2024, BTC was the best-performing asset, returning 129.0%, highlighting its high growth potential. Gold follows suit, with year-to-date (YTD) returns holding steady at 32.2%, proving its reliability as a traditional store of value. The S&P 500 remains strong, returning 28.3%. However, crude oil returned -0.13%, while U.S. Treasury yields were modest, with the 5-year yielding 5.3% and the 10-year yielding slightly higher at 8.2%.
On a one-year time horizon, Bitcoin continues to outperform other assets with a 153.1% return. Gold returned 34.8%, followed by the S&P 500 at 33.1%. The strength of these three assets demonstrates the stability of the market over the last year. However, Treasury bonds reflect sensitivity to changes in the economy, with the 5-year and 10-year bonds returning -4.3% and -2.6% respectively. The data reveal how bonds fluctuate with changes in interest rates and finances.
Over three years, the performance pattern has shifted in favor of bonds as economic stability has become more desirable. Treasury bonds lead the way, with the 5-year bond returning a whopping 267.8%, followed by the 10-year bond at 218.0%. Bitcoin followed with a 79.0% return over the period, while gold followed with a 53.1% return, providing cover against market uncertainty. Crude oil was the only asset to underperform during the period, returning 6.1%.
In five years, Bitcoin will reach its peak, returning a whopping 1,283.6%. The S&P 500 and gold held steady, returning 96.7% and 84.6% respectively, both delivering solid and consistent gains. Treasury bonds also performed well, with the 5-year Treasury bond at 157.1% and the 10-year Treasury bond at 149.9%. Crude oil has seen limited growth of just 25.3%, which does not look very attractive for long-term investing. This period shows Bitcoin’s potential for strong returns in the medium-term investment window, balanced with steady growth in stocks and gold.
Taken from a full 10-year perspective, Bitcoin’s growth rate is an unparalleled 26,931.1%, confirming its transformative investment potential for early adopters. While other assets lag far behind, they still provide solid returns, with the S&P 500 at 193.3% and gold at 125.8%. Treasury bonds also held their value, with the 5-year note returning 157.1% and the 10-year note returning 86.8%. Crude oil, however, lagged behind at 4.3%. This decade-long timeline concludes that Bitcoin is the ultimate high-growth asset, while gold, bonds, and stocks offer safer, lower-returning alternatives for risk-averse investors. However, Bitcoin is still a relatively new asset and its market capitalization is much smaller than other assets. This smaller base allows it to grow at a faster rate.
Has Bitcoin been volatile over the past 10 years?Bitcoin’s huge gains over the past decade have been accompanied by huge volatility. BTC price has been as low as $172.15 and as high as $103.6. The chart below clearly illustrates the BTC cycle, which happens coincidentally every four years after the BTC halving. Throughout the past 10 years, we have experienced 2 "bull market" cycles, which occurred in 2017-2018 and 2020-2021 respectively, and we are currently in one of them. At the end of the cycle, BTC prices tend to plummet to over 70% of their peak. This causes BTC to fluctuate. This extreme variability highlights the high-risk, high-reward nature of Bitcoin, making it attractive to growth-focused investors but challenging for those looking for stability.
Is Bitcoin’s performance correlated with other assets?Volatility aside, Bitcoin’s relationship to other major assets like the S&P 500 and gold can provide further insight into its unique behavior. Correlation analysis reveals how Bitcoin has aligned or failed to align with traditional markets:
Bitcoin and the S&P 500Bitcoin and the S&P 500 Over the Years The correlation (shown as the blue line) has been unstable, often hovering near zero until 2018. This low correlation suggests that Bitcoin’s performance during this period was largely independent of the stock market. However, the relationship has strengthened since 2020, with Bitcoin becoming even more closely related to stocks during major economic events like the COVID-19 pandemic. The price correlation is also consistent with BTC’s upward trend in 2018, 2020, and 2020.
Bitcoin and GoldIn the case of gold, Bitcoin’s correlation is inversely proportional to its correlation with the S&P 500 Index. This shows that Bitcoin and gold (shown as the green line) tend to be independent of each other, even though both are considered alternative investments. A correlation was also observed withBTC price does the opposite. As prices increase, correlations decrease and vice versa. This suggests that when Bitcoin underperforms, investors tend to turn to gold investments. However, brief spikes in correlation often occur during macroeconomic events and reflect moments when both assets react to similar market conditions. Still, Bitcoin has yet to fully become the digital equivalent of gold.
Ten-year comparison between Bitcoin and traditional assetsThe price returns of Bitcoin and traditional assets within 10 years are as follows:


